Dashboard hub

Jidapa Pooljan

Data Analyst · Data Engineering · Data Governance

Summary

I build the whole data path: pipelines that load it, rules that keep it trustworthy, and dashboards people actually use.

Full-time Data Analyst at an FMCG import company, where I own the data from source file to decision.

Data engineering
Moved sales, product, customer and stock data from Excel into PostgreSQL and rebuilt the ETL in Python, about 85% faster, with scheduled pulls from 9+ sources.
Data governance
Checks that block bad data before load, read-only database access, and password levels for sensitive figures. Documented in a governance pack.
Analytics
Sales, margin and stock analysis, delivered as password-protected dashboards leadership opens from any browser.

Background in geotechnical engineering; finishing a Master's in Applied Data Science with hands-on ML, NLP and LLM projects.

~85%Faster ETL

4 h → 35 min

ImpactFaster month-end reporting

9+Sources, one pipeline

Same checks for every source

ImpactConsistent numbers

6 → 1Single-source migration

Excel files → PostgreSQL

ImpactOne version of the truth

Min → secFaster queries

200k-row Excel → SQL

ImpactQuick, sure decisions

Experience

What I built at VCAN Group

15 responsibilities in 4 areas: what I did and what changed. Open “Example” for a real case.

Data Analyst · VCAN Group

Aug 2025 – Present

FMCG import company. I own the data end to end: extract it from source systems, transform it through Python data pipelines into PostgreSQL, and turn it into dashboards and analysis that answer business questions.

Data engineering & automation · 5

Moved core data from Excel into PostgreSQL

Designed the schema for sales, product, customer and stock data, then migrated it.

  • One source of truth; new reports plug in without rebuilding
  • Fixed incorrect data that had crept in from Excel
  • One date format across all sources

ImpactTrusted numbers for decisions: no sales tied to the wrong SKU, and new reports added without rebuilding.

Example
  • Mixed dates (1/12/25, 2025-12-01, 12/1/25) unified to YYYY-MM-DD, removing false gaps in trend charts.
Data modelingPostgreSQL

Rebuilt the ETL in Python, ~85% faster

One typed pipeline for every source, replacing per-file manual cleanup.

  • Monthly run: ~4 hours → ~35 minutes
  • Same rules for every source, so results match
  • Bad codes and missing pack sizes caught before load

Impact~85% of processing time freed for analysis, with fewer errors reaching reports.

Example
  • Caught a batch with 14 product codes missing from the product master, before their sales silently became zero.
ETLPythonsale_in_vcan1 · private repo

Automated data pulls and report emails

Python + Selenium scripts export portal data; Task Scheduler runs them on a schedule.

  • No manual downloads or tracking which files are new
  • Summary emails reach sales and managers automatically

ImpactRecurring data and reports arrive on time without manual work.

Example
  • Every Monday 07:00 a script logs in to the supplier portal and exports the month's sales.
AutomationSeleniumTask Scheduler

PDF purchase orders to structured data

Vendor PO PDFs → tables → Excel/CSV, on request.

  • No manual entry for mall-level sales analysis
  • Evidence-ready numbers for legal and accounting

ImpactLocked PDF records become analysable data, saving processing time per PO batch.

Example
  • Legal needed annual cost figures: a batch of vendor POs turned into one summary table on short notice.
PythonPDF extractionExtract_PO_Files ↗

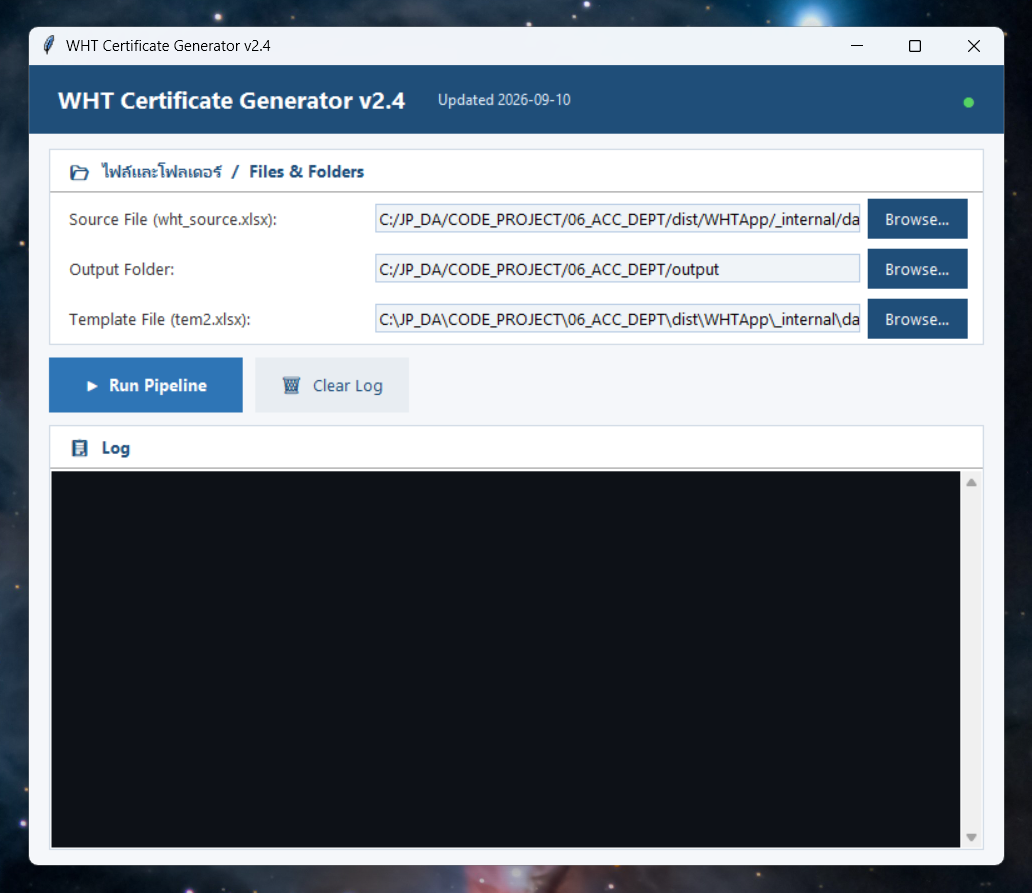
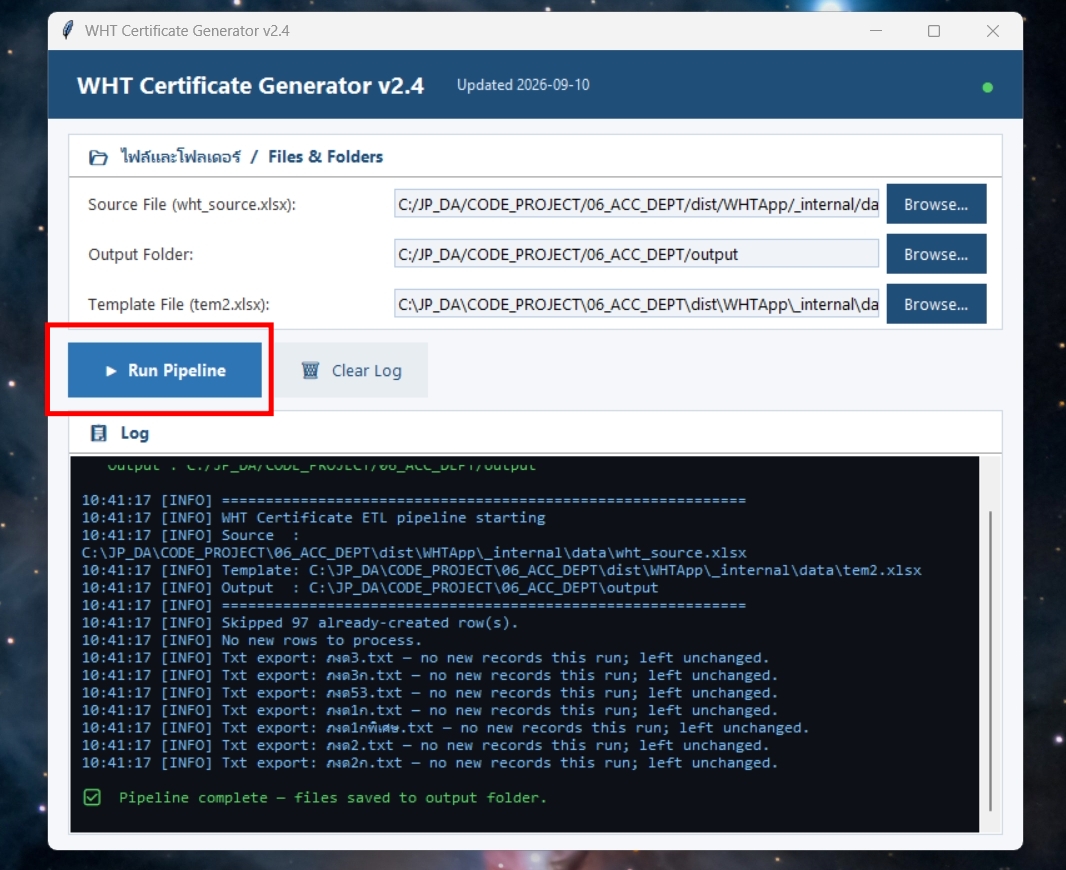
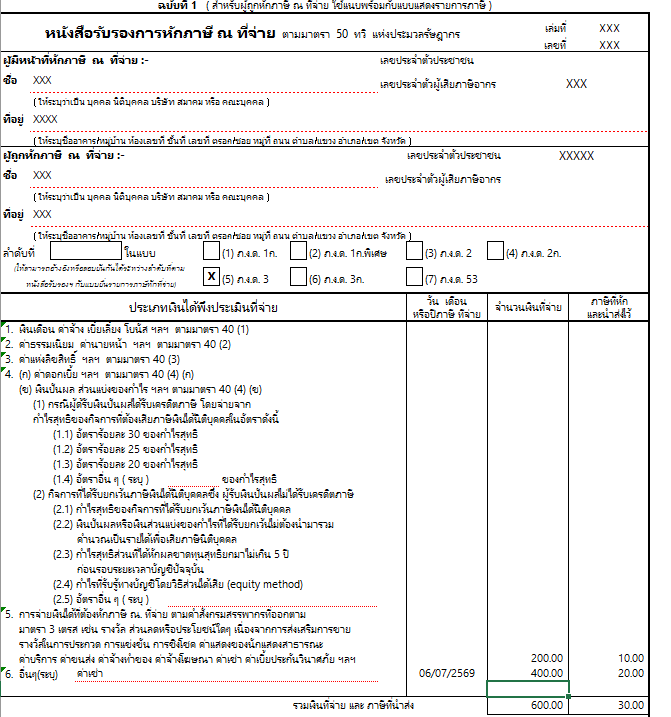
Accounting app: withholding-tax certificates from Excel

Desktop app that converts raw accounting data for the Express system, including Thai withholding-tax certificates (ภ.ง.ด. 3/3ก/53). Handles several source layouts.

  • Accounting reviews a few checks instead of typing every record
  • Also writes the Revenue Department upload files (ภ.ง.ด. 3/53), matched to each certificate

ImpactSaves the finance team's time on every filing round: certificates and Revenue Department files come out correct and consistent in one run, so submitting on the RD website goes smoothly.

AutomationDesktop appVCAN_04_ACC_DEPT · private repo

Analytics & dashboards · 4

Sales and executive dashboards

HTML dashboards (Python + PostgreSQL + Chart.js): brand, mall, salesperson, stock value, shipments.

  • Top and weak stores, brands and reps visible at a glance
  • Leadership opens them from any browser
  • Some fully automated: download → ETL → build → publish

ImpactSharper sales strategy, with self-service visibility for leadership anytime.

Example
  • The stock dashboard rebuilds itself on a schedule. Four are shown in Projects.
BIChart.jsVCAN_03_DASHBOARD · private repo

Product, promotion and margin analysis

Sales by product, promotion, season, margin and mall.

  • Shows what drives margin, guiding pricing and mix
  • Hard numbers for key-account negotiations
  • Input to decisions on new imports

ImpactDirectly informed pricing, product mix and new-import decisions.

Example
  • One brand slowed after its promotion ended; management booked a follow-up promotion before sales fell further.
Business analysisSQL

Stock risk alerts

Flags low stock for imports and items selling faster than their stock cover.

  • Sales can prioritise or hold orders early

ImpactLower stockout risk and fewer lost sales.

Example
  • Caught a top seller that would have run out mid-promotion.
Inventory analytics

Reporting for auditors and vendors

Net sales reports, vendor forecasts and reconciled data on request.

  • Audit-ready figures that match the database

ImpactSupports compliance and keeps vendor relationships on solid numbers.

ComplianceForecast reporting

Data quality & governance · 4

See the governance pack →

Shared database, read-only users

Excel, Power BI and dashboards read PostgreSQL over ODBC; only the ETL can write.

  • No version conflicts or bloated workbooks
  • Nobody overwrites a table by accident

ImpactEvery team works from the same fast data, and it stays intact.

Example
  • 6 department Excel files → 1 database; queries on 200k rows went from minutes to seconds.
ODBCGovernance

Tiered access to sensitive figures

Password levels on dashboards plus per-level database accounts.

  • Landed cost and rep performance only for senior roles
  • Controls who can edit, not just who can read

ImpactSensitive figures never exposed to general staff or outsiders.

Access controlSecurity

Validation before load

Checks that stop missing or unmapped keys reaching the database.

  • Errors caught at the source, not in reports

ImpactFewer downstream errors and less cleanup effort.

Example
  • Unmapped product codes used to load as blanks and quietly drop out of revenue; now they are blocked.
Data quality

Historical cleanup and backups

Fixed old records with wrong codes or names; scheduled PostgreSQL backups.

  • Reliable year-over-year trends after merging duplicate SKUs

ImpactReliable history for trends and forecasting; business continuity protected.

Data governance

Enablement & operations · 2

Training colleagues on data tools

Pre-test, tailored session, post-test for Excel, Power BI, dashboards and database access. First stop for data and IT help.

  • Training aimed at real skill gaps
  • Issues solved on the spot, no escalation

ImpactStaff work faster and more accurately; no escalation to other departments.

Example
  • Two-level Excel course built around a real incident: barcodes losing their leading zeros.
TrainingVCAN_06_TRAINING_EXCEL · private repo

Operations support for sales

Shares PO ETA and stock status, places warehouse orders for sales, runs the staff sales channel.

  • Sales promise delivery dates from current data
  • One fewer manual hand-off for the team

ImpactField sales sell with current stock and ETA data; plus a small extra sales channel.

Stakeholder support

Skills

Tools I use

The yellow row is what I use every working day. The other tools come from my Master's and side projects.

Daily at work

SQL · PostgreSQLPython · pandasETL pipelinesODBC / psycopg2HTML dashboards · Chart.jsPower BIExcelSelenium automationTask SchedulerAccess controlSupabaseGit / GitHub

Machine learning & deep learning

scikit-learnXGBoostPyTorchTensorFlow / KerasSpark MLlibFAISSstatsmodels

NLP, LLMs & computer vision

Hugging Face TransformersLangChainGemini APIOllamaspaCyNLTKYOLOv8OpenCVCLIPTesseract OCR

BI & analysis tools

TableauMatplotlibSeabornRRapidMinerSPSSMySQLNoSQL

Deployment & geospatial

FastAPIFlaskDockerGitHub ActionsAWS EC2 / ECS FargateNginxGradiogeopandasfoliumosmnx

Soft skills

Analytical thinkingStakeholder communicationStaff trainingDocumentationPlanningProject management

Data analysis & BI

Four of the dashboards I run at work, rebuilt as demos. Each one is a single HTML file generated by Python from PostgreSQL, with the data encrypted so it opens only with a password.

The screenshots and live demos use mock or anonymised data (Customer 10, Brand 28, Northwind), not real company figures. The live demos need the password I share with my application.
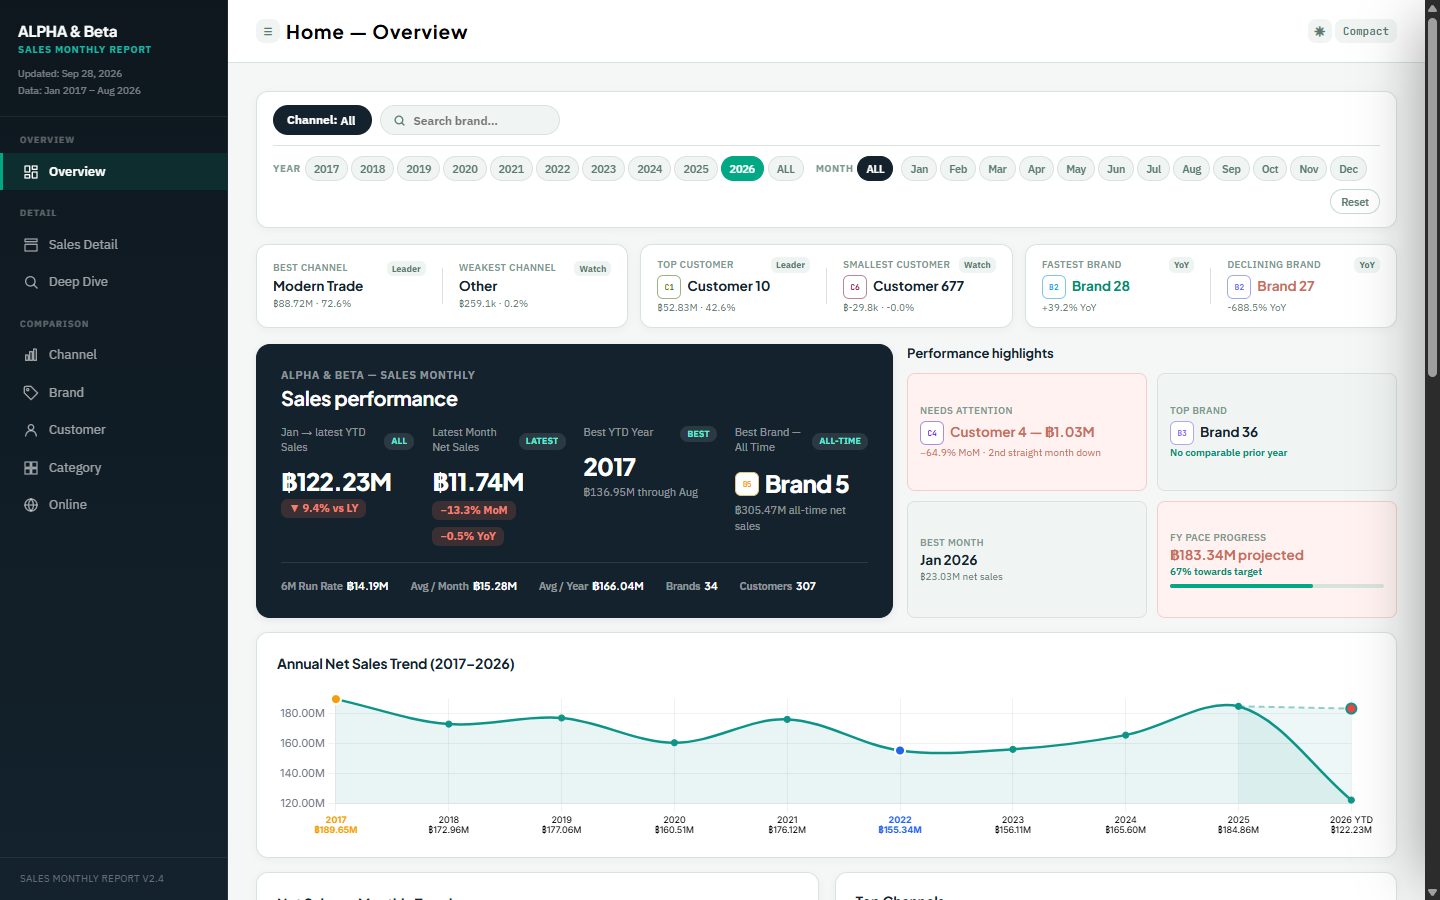
Sale-In Monthly Report dashboard screenshotView full size
SalesMonthly

Sale-In Monthly Report

Ten years of sales in one page: YoY and MoM movement, best and weakest channel, customer and brand, full-year pace against target, and drill-downs by brand, channel, customer and category.

PostgreSQLPython ETLChart.js
Open live demo
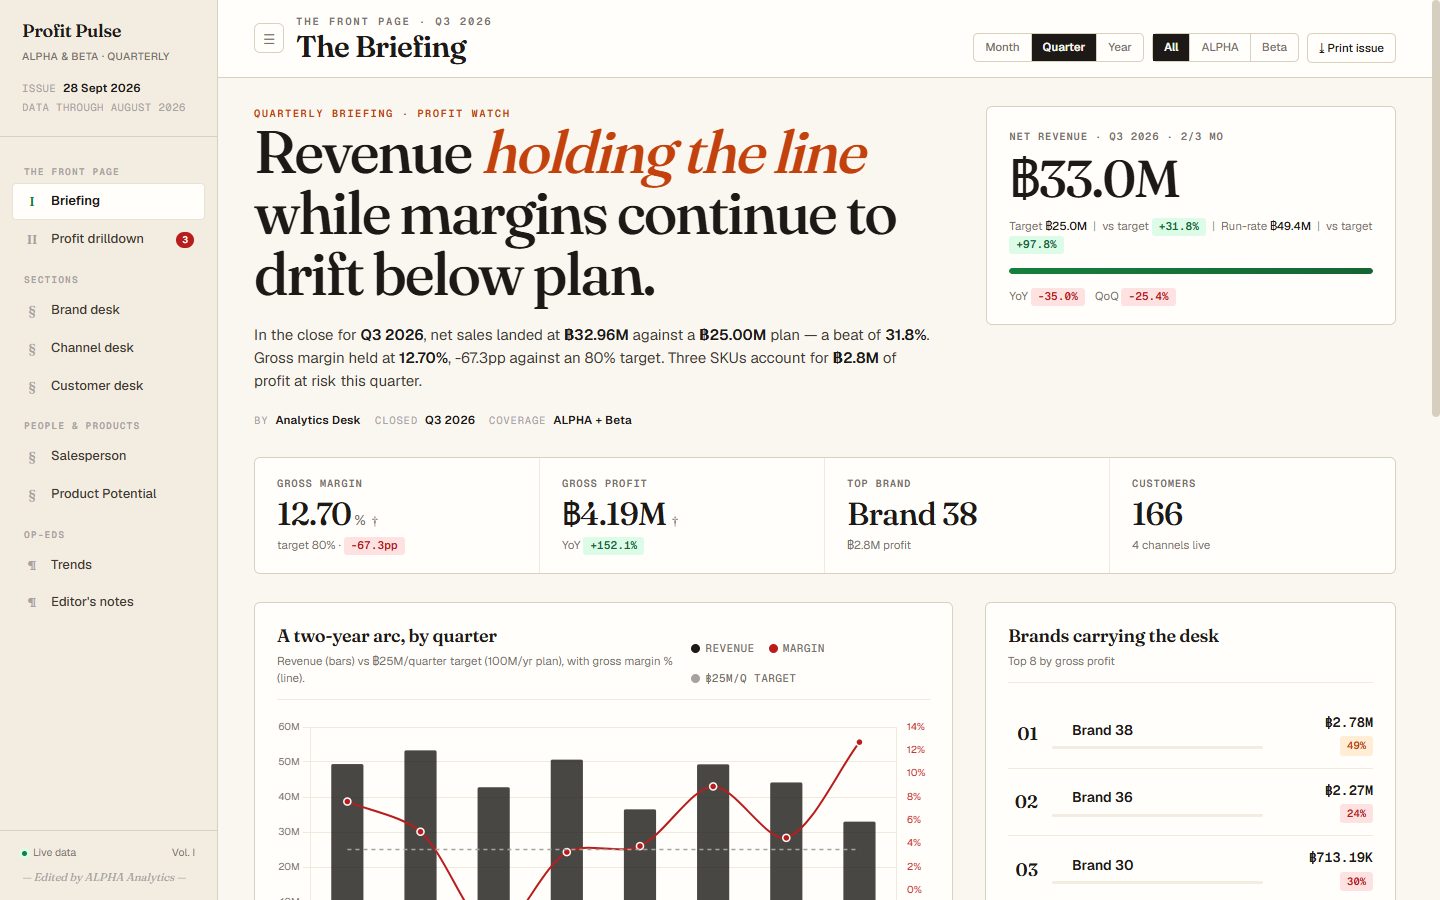
Profit Pulse executive briefing dashboard screenshotView full size
ExecutiveQuarterly

Profit Pulse executive briefing

A briefing written for leadership: revenue against plan, gross margin against target, profit at risk, and the brands carrying the quarter. The page opens with a one-line summary of the quarter.

Margin analysisKPI designStorytelling
Open live demo
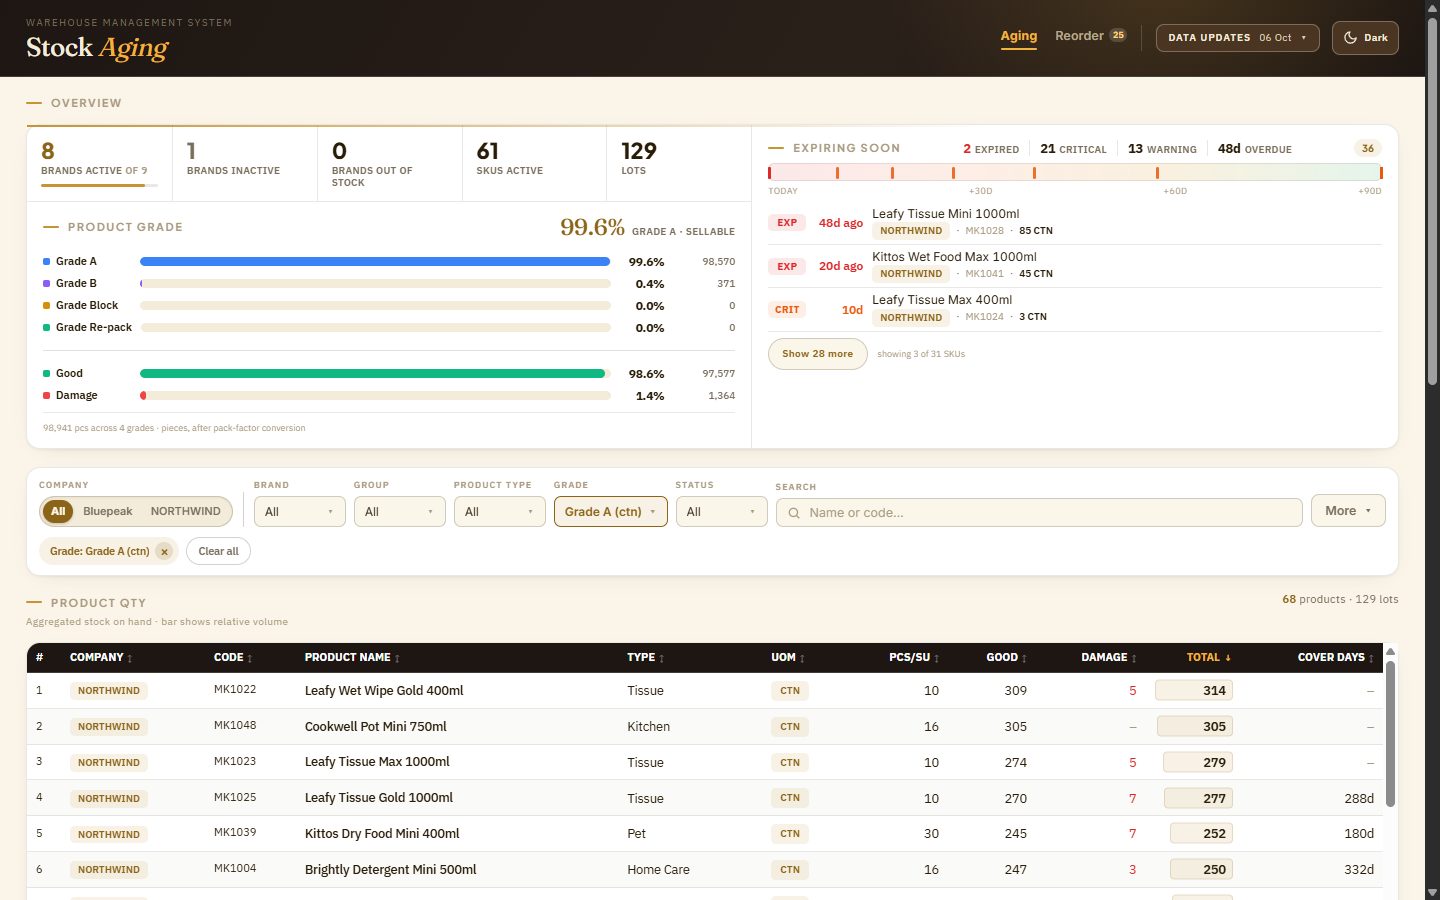
Stock Aging dashboard screenshotView full size
OperationsDaily

Stock Aging

Built from the warehouse system export: product grade and damage share, lots expiring soon or already expired, and stock cover days per SKU, so the team knows what to sell or move first.

WMS exportAutomated buildExpiry tracking
Open live demo
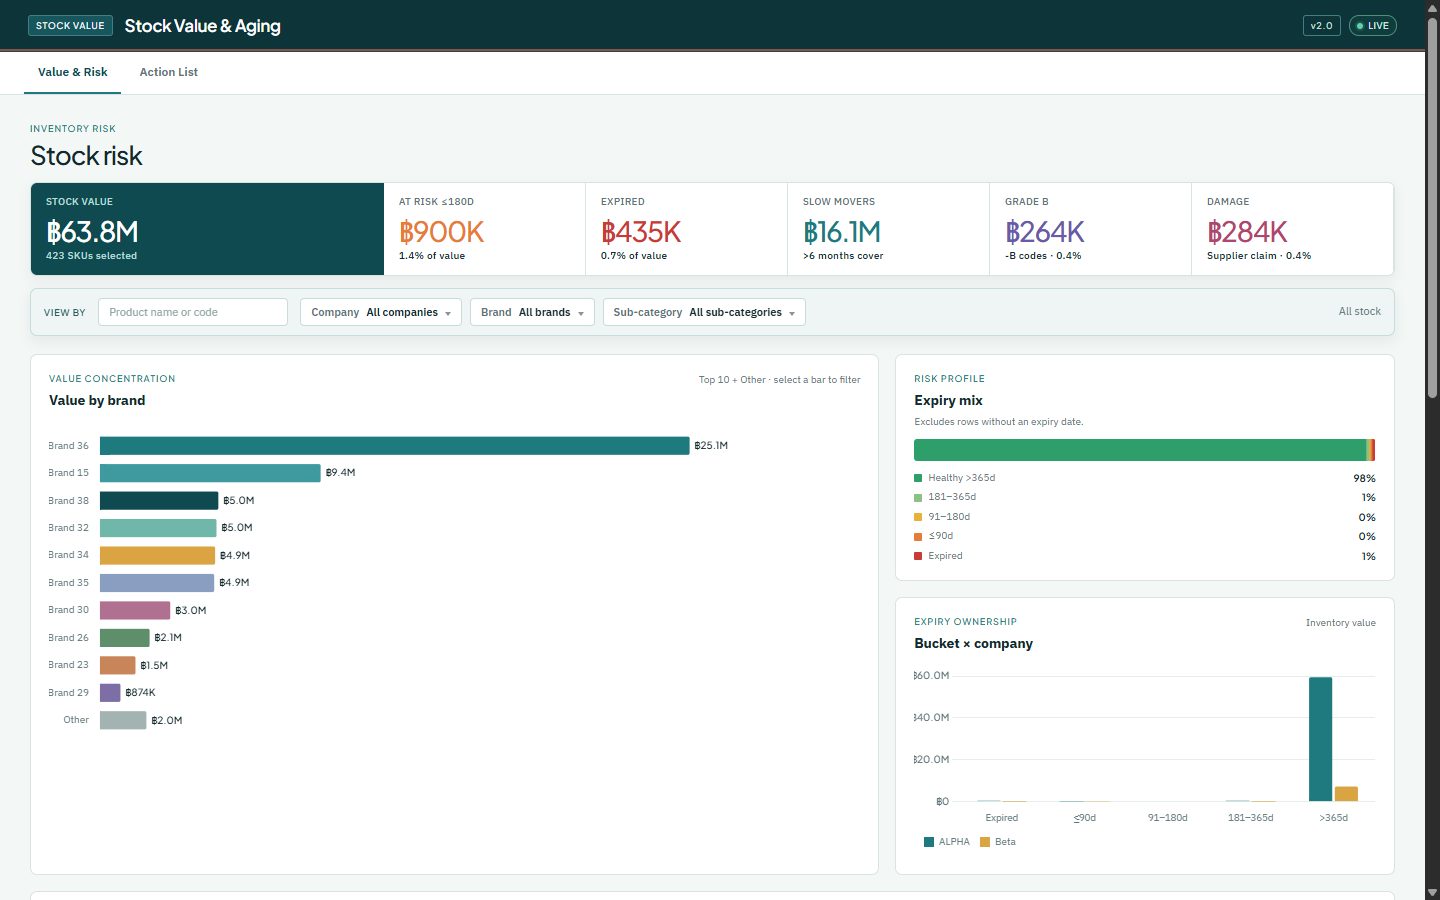
Stock Value & Aging dashboard screenshotView full size
FinanceInventory

Stock Value & Aging

Puts a baht value on stock risk: total stock value, value at risk within 180 days, expired, slow movers, Grade B and damage, with value by brand and expiry ownership by company.

Landed costValue at riskReconciliation
Open live demo

Machine learning

NLP, LLMs & computer vision

Also: Gemini API chatbot with persistent history, and a LINE chatbot on the Claude API hosted free on Google Apps Script with token-budget alerts (private). Full index: github.com/JPP-J/Portfolio_Repository.

Education & certificates

Degrees

M.Sc. Applied Data ScienceThammasat University · GPA 3.73
May 2024 – Present
B.Sc. GeotechnologyKhon Kaen University · GPA 3.14
2017 – 2020

Certificates

CHULAMOOCPython & Data Processing (basic to intermediate)
UdemySQL for Data Science
UdemyMathematics for Machine Learning

Languages

ThaiNative
EnglishIntermediate (B1/B2) · TOEIC 730

Career history

From field data to business data
Aug 2025 – Present

Data Analyst · VCAN Group

Database, ETL, dashboards and data governance for an FMCG importer. Details in Experience.

Apr 2022 – Aug 2024

Geotechnical Engineer · IEC International Engineering Consultant

Led planning and supervision of soil and rock investigations for large-scale infrastructure projects (Department of Highways, MWA, NEDA) in Laos, Cambodia and Thailand. Coordinated multi-disciplinary teams and subcontractors, planned workloads, and presented results to clients. Managed project documentation and budgets, designed engineering structures, and worked with the cost-estimate team to cut construction costs by up to 25%.

Jan 2021 – Apr 2022

Geologist · Krungthep Geotechnique

Planned and coordinated field teams on road, building and river dam protection projects. Collected and analysed field data, standardised the reporting templates project managers used, and trained staff on procedures and new equipment.

Engineering taught me to distrust a number until I know where it came from. That habit is why my data work starts with validation and ends with access control, and why I'm heading toward data governance.

Contact

What I'm looking for

  • Data Analyst, Analytics Engineer, Data Engineer or Data Governance roles
  • Owning data quality, lineage, access and documentation, not only the reports
  • Teams building one governed source of truth that the business trusts
  • Room to use ML and forecasting where it actually helps the business

What I'm working on next

  • Taking the governance pack from mock data to the live database
  • Demand forecasting models for stock planning
  • More automation to remove manual reporting steps

Let's talk

The fastest way to reach me is email: jidapa.pooljan@gmail.com